
Placer AI
Paid ✓ VerifiedPlacer AI location intelligence platform analyzes foot traffic data for site selection, retail analytics, and competitor benchmarking.
📋 About Placer AI
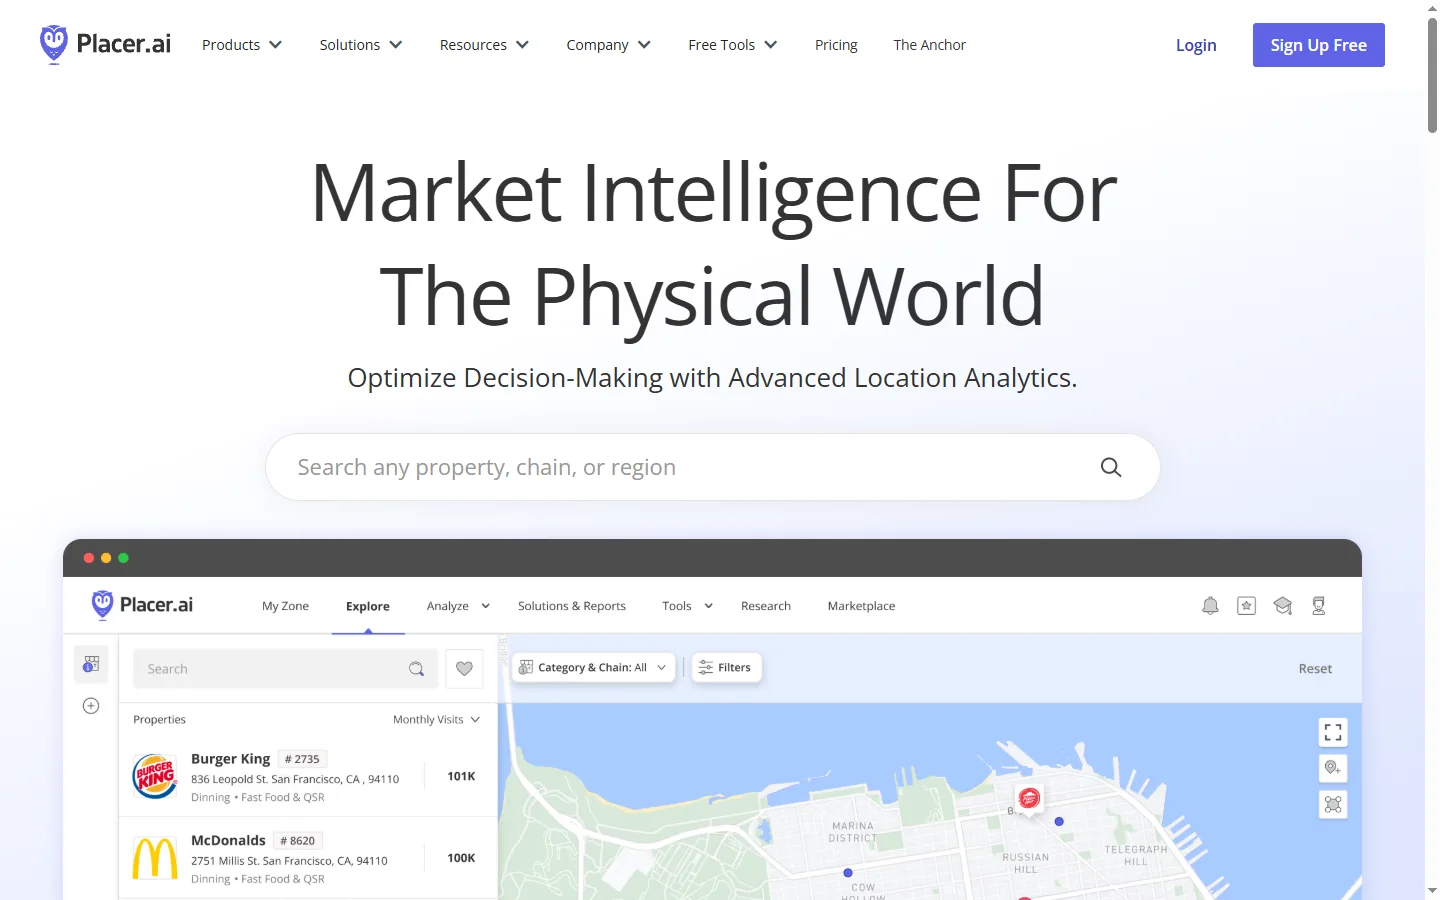
Placer AI is a placer ai location intelligence platform that uses aggregated, anonymized foot traffic data to help businesses understand consumer movement patterns across physical locations. Retailers, commercial real estate firms, restaurants, and municipalities use Placer AI to analyze how people visit specific venues, compare competitor locations, evaluate potential new sites, and measure the impact of marketing campaigns on in-store visits. The platform processes billions of location data points from opted-in mobile devices to generate visit counts, trade area demographics, cross-shopping behavior, and dwell time metrics at the address level.
Dashboards present data in visual formats including maps, trend lines, and benchmark comparisons, making it accessible to analysts and non-technical stakeholders who need to communicate findings across an organization. Placer AI is particularly valuable for site selection decisions, where traditional survey methods are slow and expensive compared to the near-real-time foot traffic data the platform provides. The ability to evaluate a potential new location against comparable venues in the same market before signing a lease reduces commercial real estate decision risk substantially.
The paid model is geared toward enterprise and mid-market customers in retail, hospitality, and commercial real estate rather than individual users. Contact with the sales team is required to obtain pricing and access, as there is no self-serve account creation path.
⚡ Key Features of Placer AI
Placer AI Foot Traffic Analytics
Access visit counts, dwell times, visit frequency, and peak hour data for any address in the placer ai database, derived from billions of anonymized location signals processed from opted-in mobile devices. Data is available at daily, weekly, and monthly granularity for trend analysis. Visit metrics can be compared across multiple time periods to identify seasonal patterns and post-event traffic changes. The platform covers a wide range of location types including retail, restaurants, entertainment venues, and commercial offices.
Trade Area and Visitor Demographic Profiling
Map the geographic catchment area of any location by visualizing where its visitors travel from, and understand the demographic composition of those visitors by age, income, and household type. Trade area mapping shows drive time and distance bands from the selected location. Demographic data helps retail and hospitality operators align marketing messaging with the actual visitor profile rather than assumed demographics. Trade area boundaries can be compared against competitor locations in the same market.
Competitor Location Benchmarking
Compare your location's visit metrics against competing venues side-by-side to identify performance gaps, market share shifts, and relative positioning within a competitive set. Benchmarking is available at both the individual location and chain level for multi-unit operators. Visit share trends over time reveal whether competitive dynamics are shifting without requiring primary market research. Clients use this data to justify remodeling investments or marketing spend changes.
Cross-Shopping and Co-Tenancy Analysis
Discover which other venues your visitors frequent before and after visiting your location to understand shopping trip context, co-tenancy synergies, and cannibalization risk from nearby competitors. Cross-shopping data identifies natural retail clustering patterns that inform leasing and marketing decisions. For shopping center operators, co-tenancy analysis reveals which anchor tenant combinations drive the most cross-shopping traffic. This data is not available through traditional sales or survey methods.
Site Selection Intelligence and Modeling
Evaluate prospective new locations by modeling expected traffic based on nearby venue mix, road access patterns, and demographic alignment with your target customer before committing to a lease or purchase. Comparable location benchmarking provides a reference range for what a new site might achieve based on similar sites in comparable markets. This reduces the reliance on gut instinct or static demographic reports that may not reflect actual behavioral patterns. Risk assessment becomes more data-driven and defensible to stakeholders.
Marketing Campaign Attribution via Foot Traffic
Measure whether specific marketing campaigns drove incremental in-store visits by comparing foot traffic during and after campaign periods against a pre-campaign baseline and control period. Out-of-home, digital, and event marketing can all be evaluated through the visit lift they generate. Attribution models control for organic seasonality to isolate the campaign's actual contribution. Results provide a physical store visitation KPI alongside digital attribution metrics.
🎯 Use Cases for Placer AI
⚖️ Placer AI Pros & Cons
Advantages
- ✓Covers a vast number of physical locations across the United States with granular address-level data
- ✓Visual dashboards make foot traffic data accessible to non-analyst stakeholders in retail and real estate organizations
- ✓Cross-shopping data reveals competitive dynamics that are invisible in internal sales data alone
- ✓Site selection modeling reduces commercial real estate decision risk before lease commitment
- ✓Trusted and adopted by enterprise retail chains, hospitality groups, and commercial real estate firms
Drawbacks
- ✗Pricing is enterprise-focused with no self-serve free tier or trial access without sales engagement
- ✗Data accuracy depends on opt-in mobile panel size, which can vary by geographic market density
- ✗Rural area coverage is weaker than urban and suburban markets where panel representation is higher
- ✗International data coverage is more limited compared to the depth and breadth of US location data
📖 How to Use Placer AI
Request a demo or contact the Placer AI sales team through placer.ai to set up an account and discuss your use case.
Enter any venue address or chain name in the search bar to pull up its foot traffic analytics dashboard.
Review visit trend charts, dwell time distributions, and peak hour patterns for the selected location.
Use the competitor comparison tool to benchmark traffic against rival venues operating in the same geographic market.
Run a trade area analysis to map where the location's visitors travel from and profile their demographic composition.
Export data reports or share dashboard links with stakeholders for site selection presentations or investment committee reviews.
❓ Placer AI FAQ
Placer AI does not offer a free self-serve tier. Pricing is based on enterprise contracts, and access requires requesting a demo and engaging with the sales team to discuss pricing based on use case and data scope.
Placer AI measures foot traffic including visit counts, dwell times, visit frequency, trade area geography, visitor demographics, and cross-shopping behavior at specific physical locations using aggregated anonymized mobile location data.
Placer AI derives data from a large panel of opted-in mobile devices and uses statistical scaling to represent total population behavior. Accuracy is strongest in dense urban and suburban markets and for high-traffic national chains, and less precise for low-traffic or rural sites with smaller panel representation.
Both platforms use mobile location data for physical world analytics. Placer AI focuses on a polished, dashboard-driven experience suited to business users in retail and real estate. SafeGraph offers more raw data access appealing to analytics teams doing custom analysis. Placer AI is generally easier for non-technical business users to adopt without data engineering support.
Retail chains, quick-service restaurants, commercial real estate firms, municipalities, hospitality groups, and financial analysts studying physical retail performance are the primary users of Placer AI's location intelligence platform.
Related to Placer AI


Featured on WhatIf.ai
Add this badge to your website to show you're listed on WhatIf AI
Alternatives to Placer AI
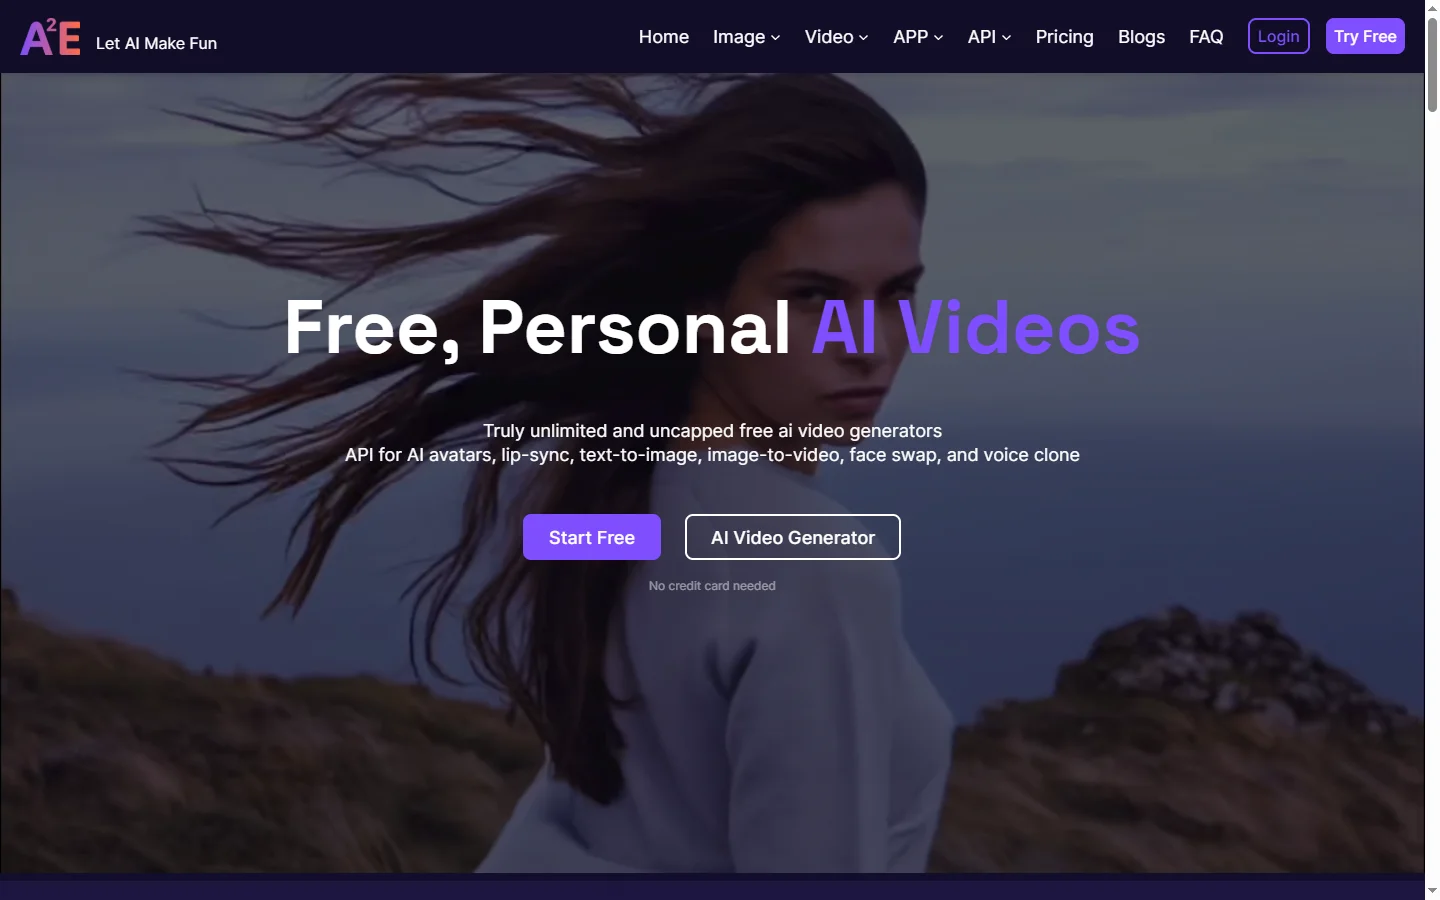

A2E AI
A2E AI productivity platform converts audio and video recordings into transcripts, summaries, and action items with speaker identification.


Abnormal AI
Abnormal AI uses behavioral AI to detect business email compromise, account takeover, and socially engineered phishing that bypasses secure email gateways.
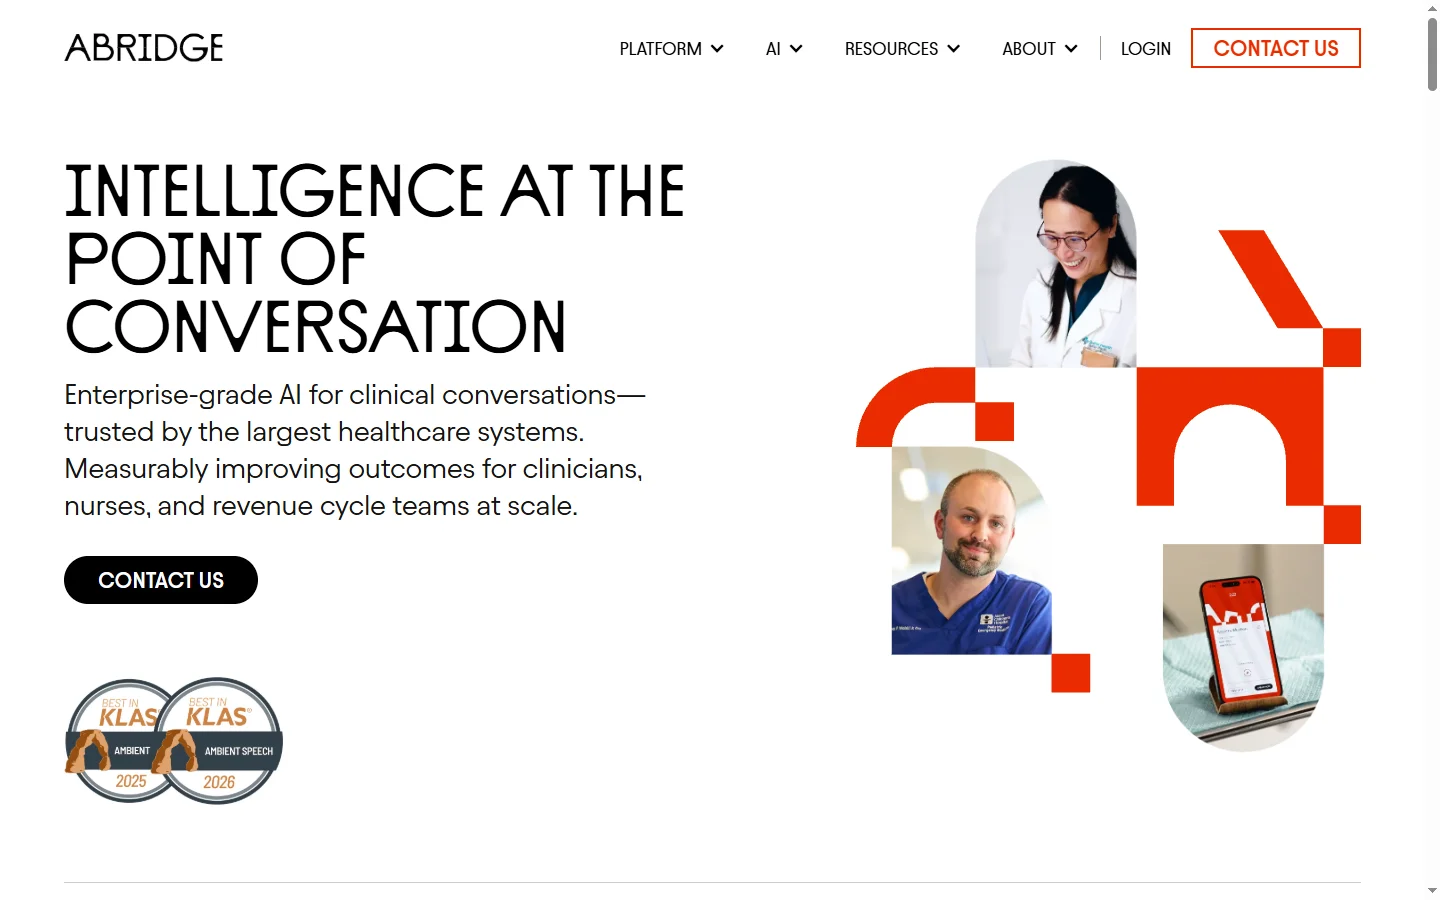

Abridge AI
Abridge AI medical documentation platform that records and summarizes clinical conversations into structured physician notes in real time.
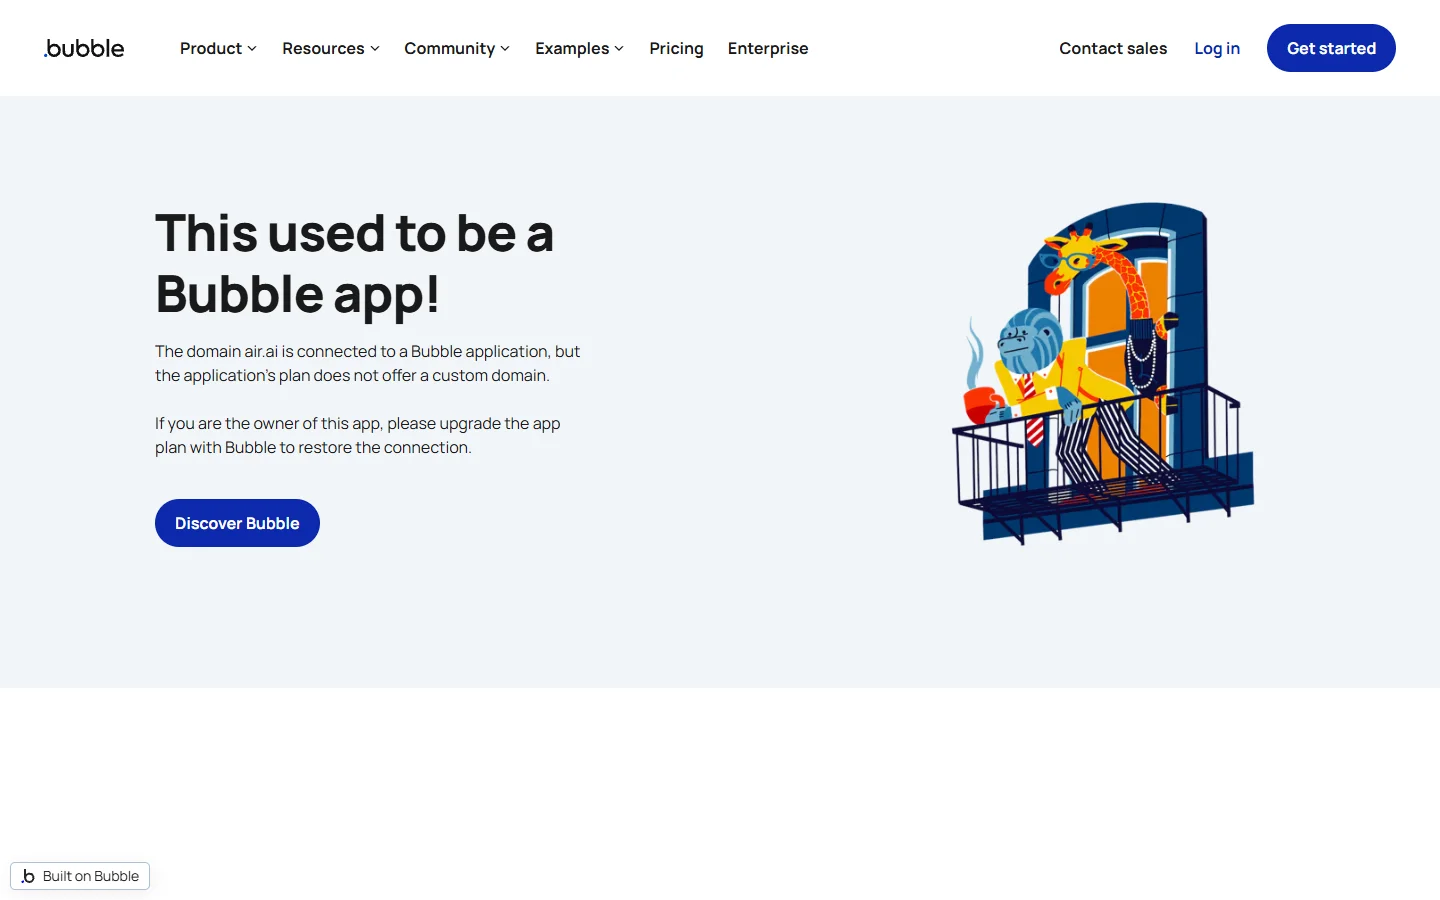

Air AI
Air AI conducts autonomous full-length AI phone calls for sales prospecting, appointment setting, and customer service without human agents.